
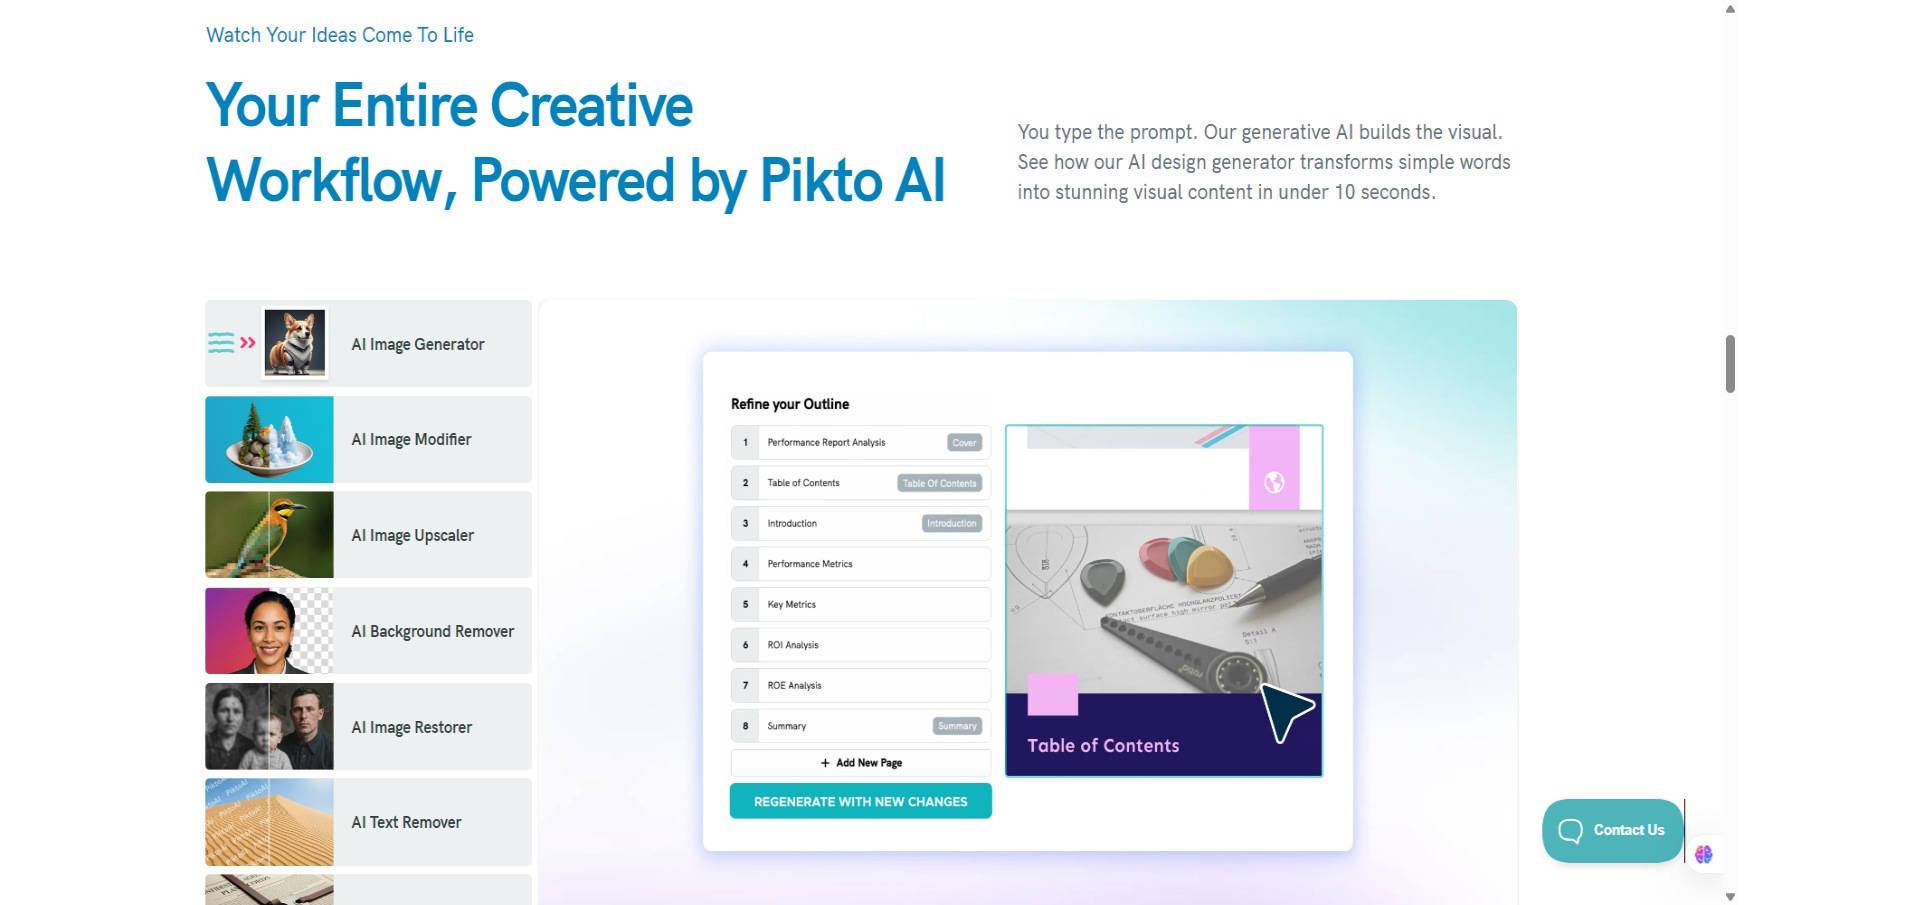
Piktochart is an online visual content editor focused on infographics, presentations, reports, and simple data visualizations. It’s built for non-designers who still want polished, professional-looking visuals.
You work in a browser. Pick a template, edit text, add icons or charts, and export your design.
Clear visuals make ideas easier to understand and more convincing. Piktochart is especially useful for marketers, educators, nonprofits, and internal teams who need to explain data, processes, or results without hiring a designer.
It saves time, reduces design friction, and keeps brand visuals consistent across teams.
You start with templates for infographics, presentations, reports, posters, or social visuals. Content is edited via drag-and-drop. Built-in charts turn spreadsheets into visuals, and brand kits help lock in fonts and colors.