
observable_logo

Observable

Rating: 4.6
User Satisfaction: 92%
Observable is a tool that lets teams build interactive data visualizations and notebooks in JavaScript so they can explore data, share insights, and publish live dashboards.

Alternative To

Overview

Observable is a web-based platform for creating interactive data visualizations using JavaScript. At its core are live notebooks where code, charts, text, and data all stay in sync. Think of it as a modern alternative to static BI dashboards or Python notebooks, but built for the web from day one.

It’s widely used by data journalists, analysts, engineers, and product teams who want to publish interactive charts, explorable reports, or embedded visualizations.

Most data tools either lock you into rigid dashboards or require heavy engineering work to publish anything interactive. Observable sits in between.

You get:

  • More flexibility than traditional BI tools
  • More approachability than building custom D3 apps from scratch

It’s especially valuable when you need to explain data, not just query it—public-facing dashboards, internal decision tools, data storytelling, or product analytics that need custom visuals.


Details

Tool Launch / Founded Date

2016-01-01 (approx.)

Best for

Data analysts, engineers, data journalists, product teams, research orgs

Access Type

Freemium + Paid Subscription

Licensing Model

Proprietary platform; users retain rights to their data and visualizations

Feature

  • Live, reactive JavaScript notebooks
  • Built-in visualization libraries (Observable Plot, D3 support)
  • Real-time collaboration and sharing
  • Publish notebooks as web apps or embeds
  • Public and private workspace options
  • Version history and notebook forking
  • Strong support for data storytelling and explanation
  • Integrates with APIs, files, and databases

Pricing Tables

Pricing Model
Custom Pricing
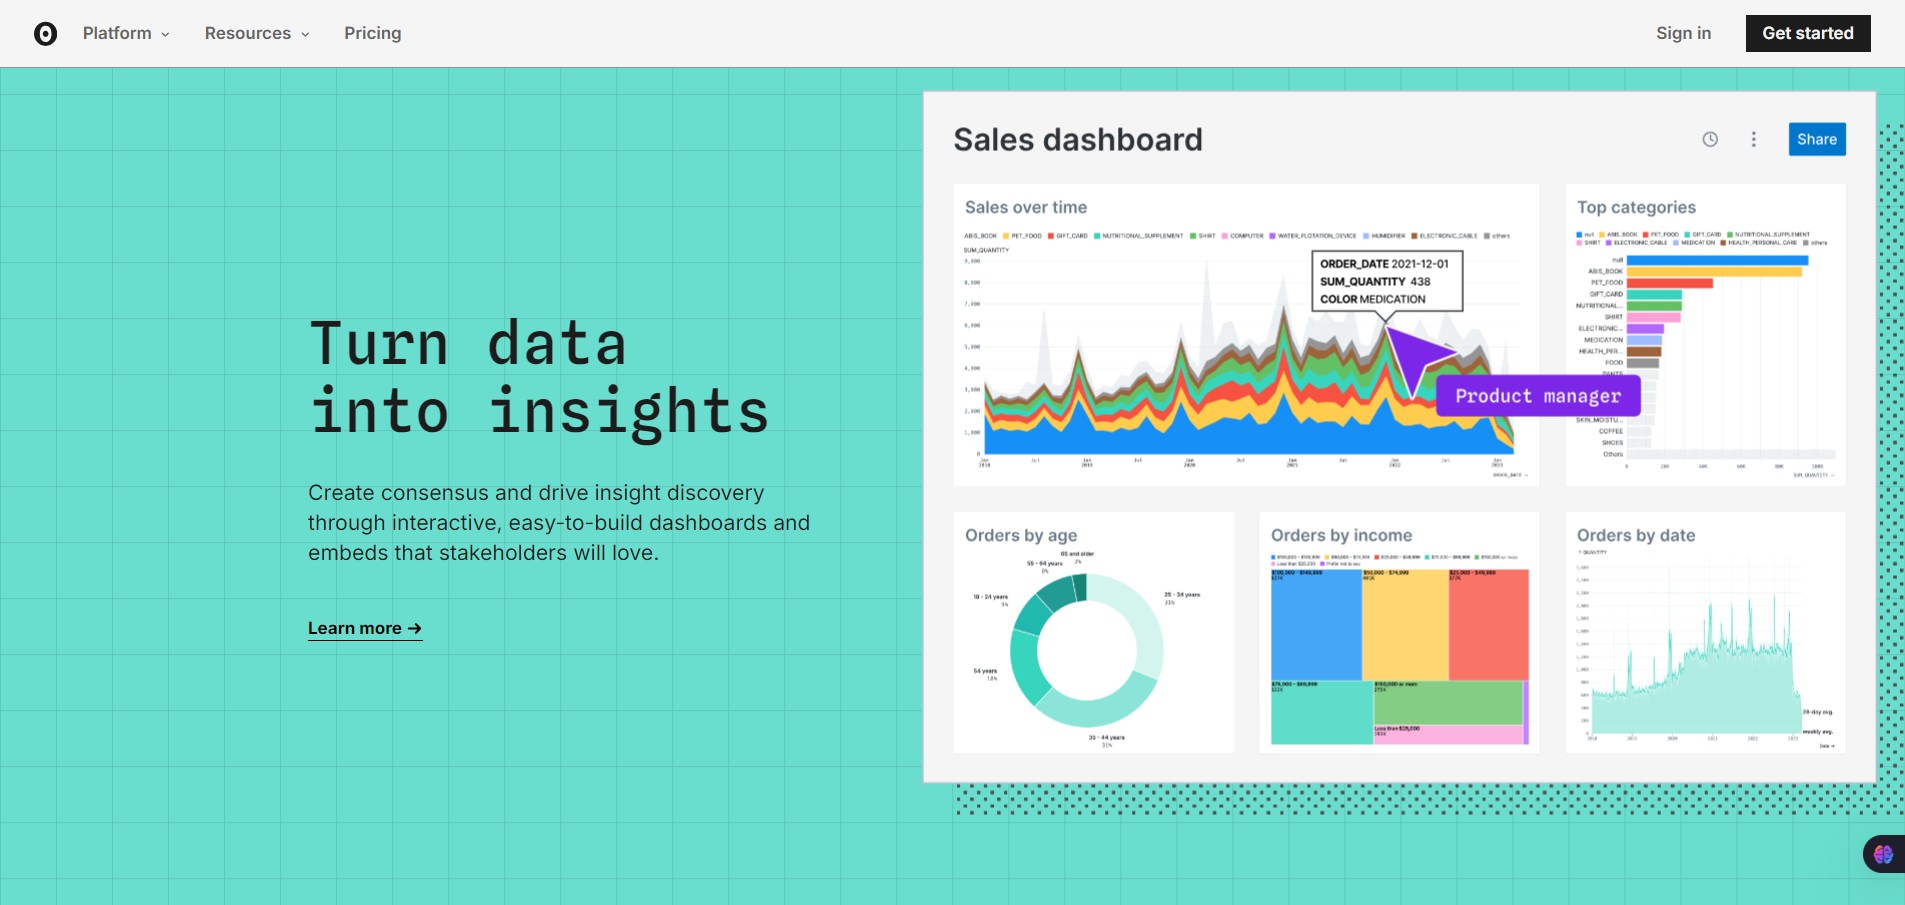
  • Deeply explore data, build interactive charts, and share insights with stakeholders — all in one platform.

Analytics

Traffic Analysis

Domain Rating
81
Organic Traffic
447.66K
Majority Users
United States

Visits Over Time

No visit data found.

Traffic Sources

No traffic data found.

Last Update Date: 2026-01-21

FAQ

Can I use Observable for commercial projects?
Yes. You can use Observable notebooks and visualizations commercially, including embedding them in products or client work.
Do I need to know JavaScript?
Yes. Observable is JavaScript-first. Familiarity with JS and basic data concepts is required.
Can I keep my work private?
Only on paid plans. Free accounts publish notebooks publicly by default.
Does Observable replace BI tools like Tableau?
Not fully. It’s better for custom visuals and storytelling, less suited for standardized reporting across large orgs.
Can I embed visualizations on my own site?
Yes. Notebooks and components can be embedded via iframe or JavaScript.
Does Observable train on my private data?
Private notebooks are not publicly visible. Public notebooks are accessible by design.

Related AI Tools

MagicTales is a tool that creates personalized AI-generated storybooks from a child’s photo so families can give unique
MakeMyTale is a tool that creates personalized AI-generated stories for children so they can explore creativity, develop storytelling
MagicTalesAI is a tool that generates personalized bedtime stories for children so parents can create engaging, customized reading
SidekickBar is a desktop AI workspace that gives users access to multiple AI assistants in one sidebar so
Nily AI is a productivity platform that combines multiple AI models and workflow tools into one workspace so
CoChat is an AI collaboration platform that lets teams work with multiple AI models, shared workspaces, and automations