
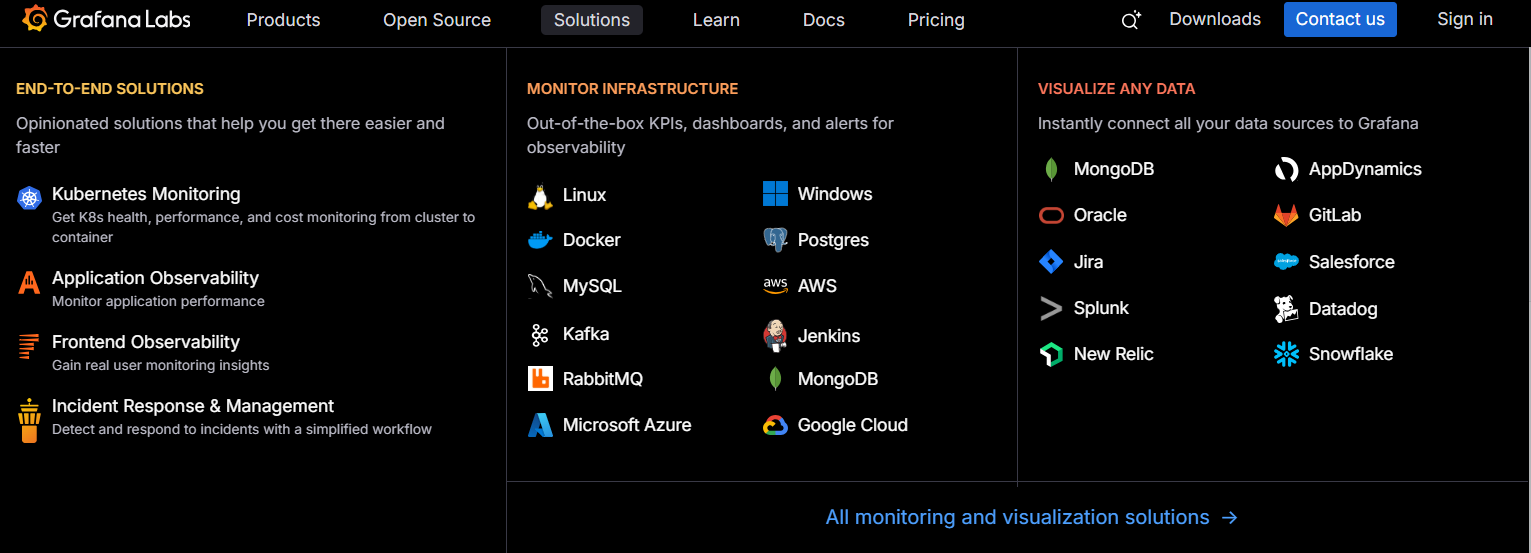
Grafana is a data-visualisation and observability tool that helps you bring together metrics, logs and traces from many sources, build dashboards, set alerts and explore your data in one place. It offers both self-hosted open-source deployment and a cloud version.
For teams operating production systems or complex infrastructure, having visibility across metrics, logs and traces is key to understanding issues, maintaining uptime and improving performance. Grafana’s strength is its flexibility: you can connect dozens of data sources (e.g., Prometheus, Loki, relational DBs, Elasticsearch) and build visual insights rather than relying on separate tools for each silo.
If you’re a founder, SRE, devops or platform engineer, Grafana gives you a way to surface and act on observability signals in one place rather than scattered dashboards.
You either deploy Grafana (self-hosted) or use Grafana Cloud. You connect data sources (metrics, logs, traces). You build dashboards via a UI or query editor. You set alerts and thresholds. You can extend via plugins. The cloud version includes additional managed services (logs ingestion, tracing, alert routing).