
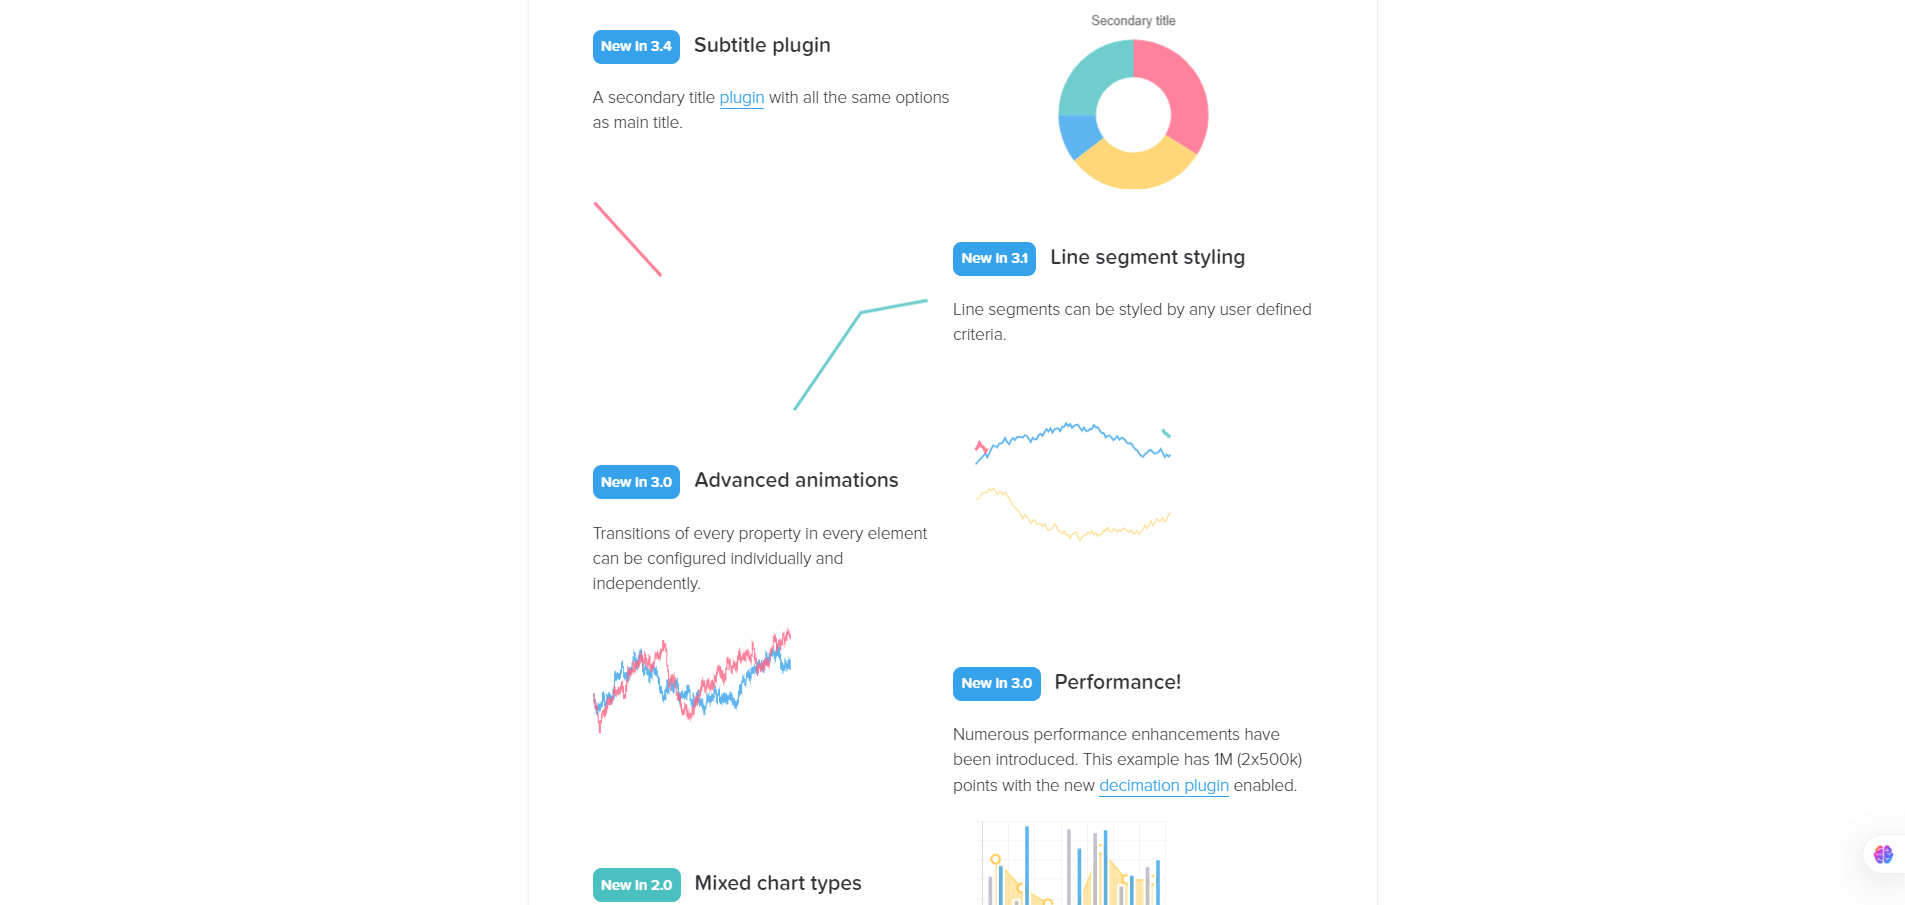
Chart.js is an open-source JavaScript charting library designed for developers who want clean, lightweight charts without buying a commercial tool. It runs in the browser using HTML5 Canvas and works with modern frameworks like React, Vue, Svelte, and vanilla JS.
If you need charts that “just work” and don’t want the complexity of enterprise analytics libraries, Chart.js hits the sweet spot. It’s small, stable, and easy to extend. Teams use it for dashboards, admin panels, embedded analytics, and quick prototypes. You avoid vendor lock-in because it’s fully open source and MIT-licensed.
You install via npm or a CDN, create a <canvas> element, pass in your dataset and chart type, and Chart.js handles rendering. It supports animations, tooltips, responsive resizing, plugins, and theming. You can customize almost anything through configuration objects or custom plugins.