
chart.js logo

Chart.js

Rating: 4.6
User Satisfaction: 90%
Chart.js is a JavaScript library that helps developers quickly create responsive charts so they can visualize data with minimal configuration.

Alternative To

Overview

Chart.js is an open-source JavaScript charting library designed for developers who want clean, lightweight charts without buying a commercial tool. It runs in the browser using HTML5 Canvas and works with modern frameworks like React, Vue, Svelte, and vanilla JS.

If you need charts that “just work” and don’t want the complexity of enterprise analytics libraries, Chart.js hits the sweet spot. It’s small, stable, and easy to extend. Teams use it for dashboards, admin panels, embedded analytics, and quick prototypes. You avoid vendor lock-in because it’s fully open source and MIT-licensed.

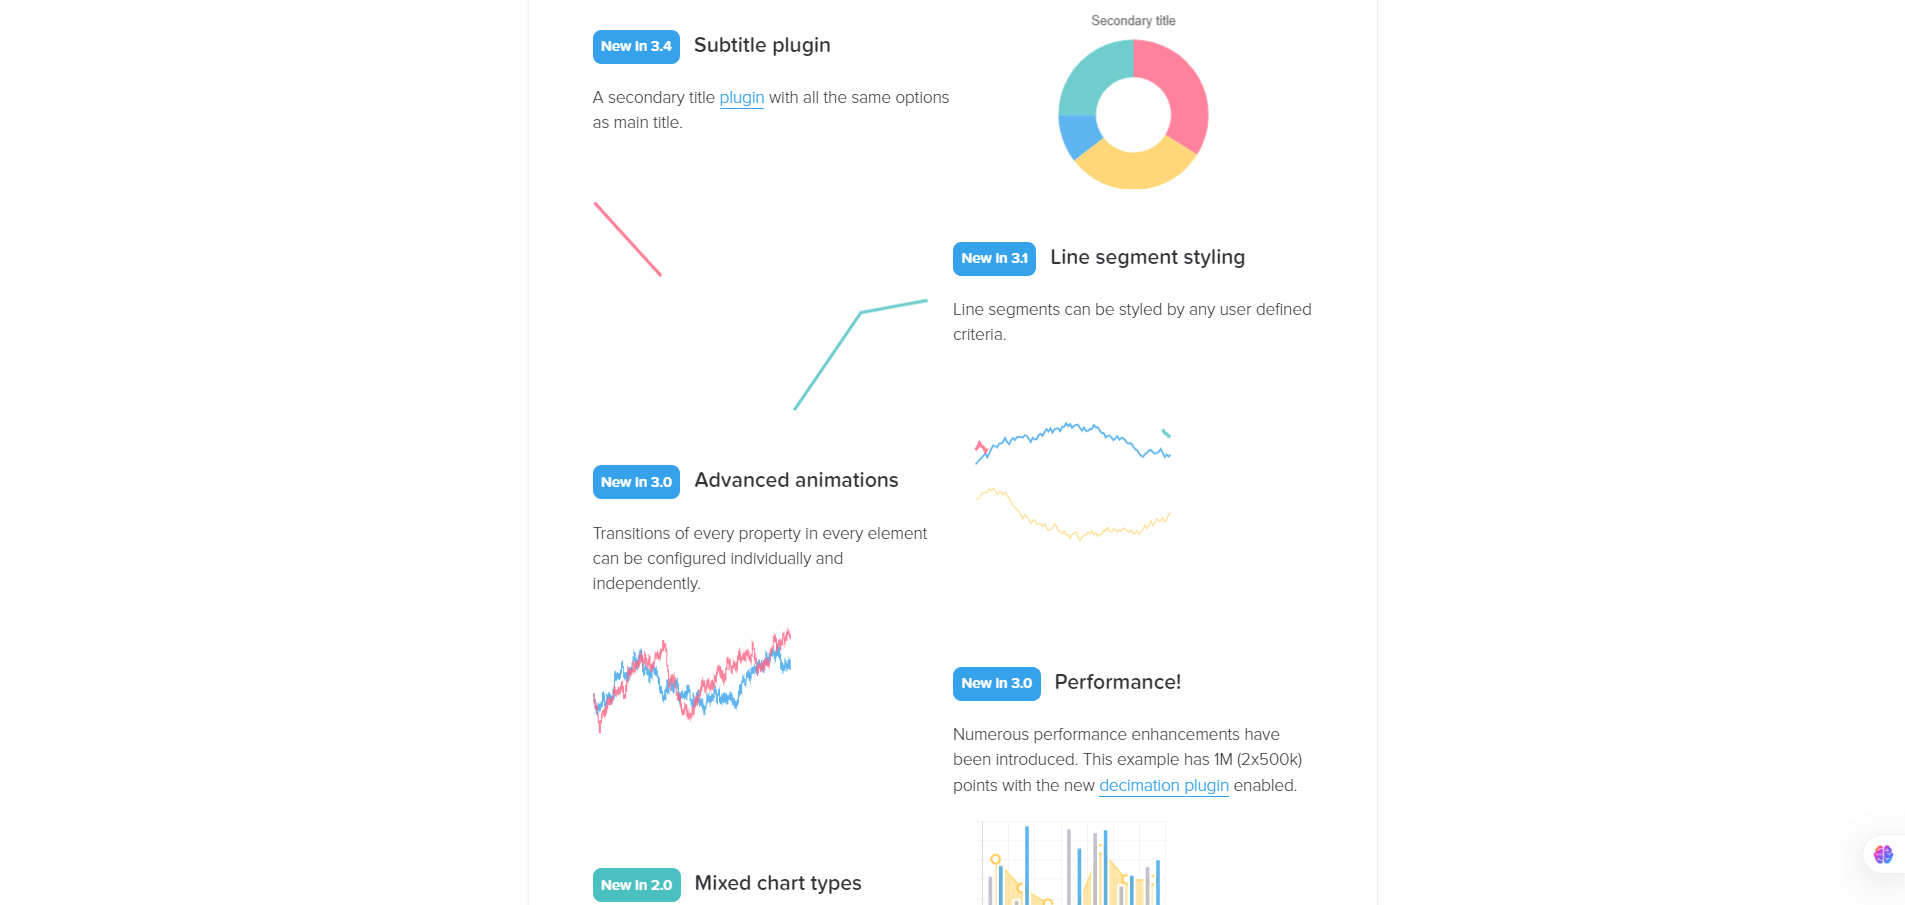
You install via npm or a CDN, create a <canvas> element, pass in your dataset and chart type, and Chart.js handles rendering. It supports animations, tooltips, responsive resizing, plugins, and theming. You can customize almost anything through configuration objects or custom plugins.


Details

Tool Launch / Founded Date

2013-01-01 approx.

Best for

Front-end developers, product teams, internal tools, open-source projects

Access Type

Free, open source (MIT license)

Licensing Model

MIT — free for commercial use, modification, and redistribution. No attribution required but appreciated.

Feature

  • Simple configuration for common chart types: line, bar, pie, radar, bubble, scatter, etc.
  • Smooth animations out of the box.
  • Responsive charts that scale with the browser window.
  • Canvas-based rendering for good performance and crisp visuals.
  • Plugin system for tooltips, legends, interaction, and custom behaviors.
  • Works with React, Vue, and other frameworks via community wrappers.
  • Theming and custom styling with fine-grained options.

Pricing Tables

There are no paid plans, no usage caps, no licensing restrictions, and commercial use is fully allowed.

Analytics

Traffic Analysis

Domain Rating
83
Organic Traffic
431224
Majority Users
United States

Visits Over Time

No visit data found.

Traffic Sources

No traffic data found.

Last Update Date: 2025-12-07

FAQ

Can I use Chart.js commercially?
Yes. It’s MIT-licensed, so you can use it for personal, commercial, or enterprise projects without paying or adding attribution.
Does Chart.js work with React or Vue?
Yes. You can use it directly or via community wrappers like react-chartjs-2 or vue-chartjs, which make integration easier.
How many charts can I render?
There are no limits. Performance depends on dataset size and browser capabilities, not licensing.
Can I customize the look and feel?
Almost everything is customizable — fonts, colors, scales, animations, plugins, and interactions. You can also write your own plugin for custom logic.
Is Chart.js good for large datasets?
It handles moderate datasets well, but for tens of thousands of points you may see lag. Tools like ECharts or WebGL-based libraries handle bigger workloads better.
Does Chart.js collect or send data anywhere?
No. It runs entirely in the browser and doesn’t transmit any data.
Is there official support?
No paid support. You rely on GitHub issues, community discussion, and third-party tutorials.

Related AI Tools

JimmyGPT is an AI chatbot tool that helps individuals chat, brainstorm, and get coding or writing assistance through
Dreamland Stories is a tool that helps kids create personalized AI-generated stories with images and narration so they
WriteMyEssay.ai is a tool that generates academic essays, outlines, and citations for students so they can draft papers
StoryHero is an AI storytelling tool that creates personalized illustrated stories for children so parents, teachers, and kids
MindChat is a mental wellness and concussion monitoring platform that combines AI assessments with EEG data for clinicians,
FanFicGen is a tool that generates AI-written fan fiction stories for fandom creators so they can brainstorm plots,