
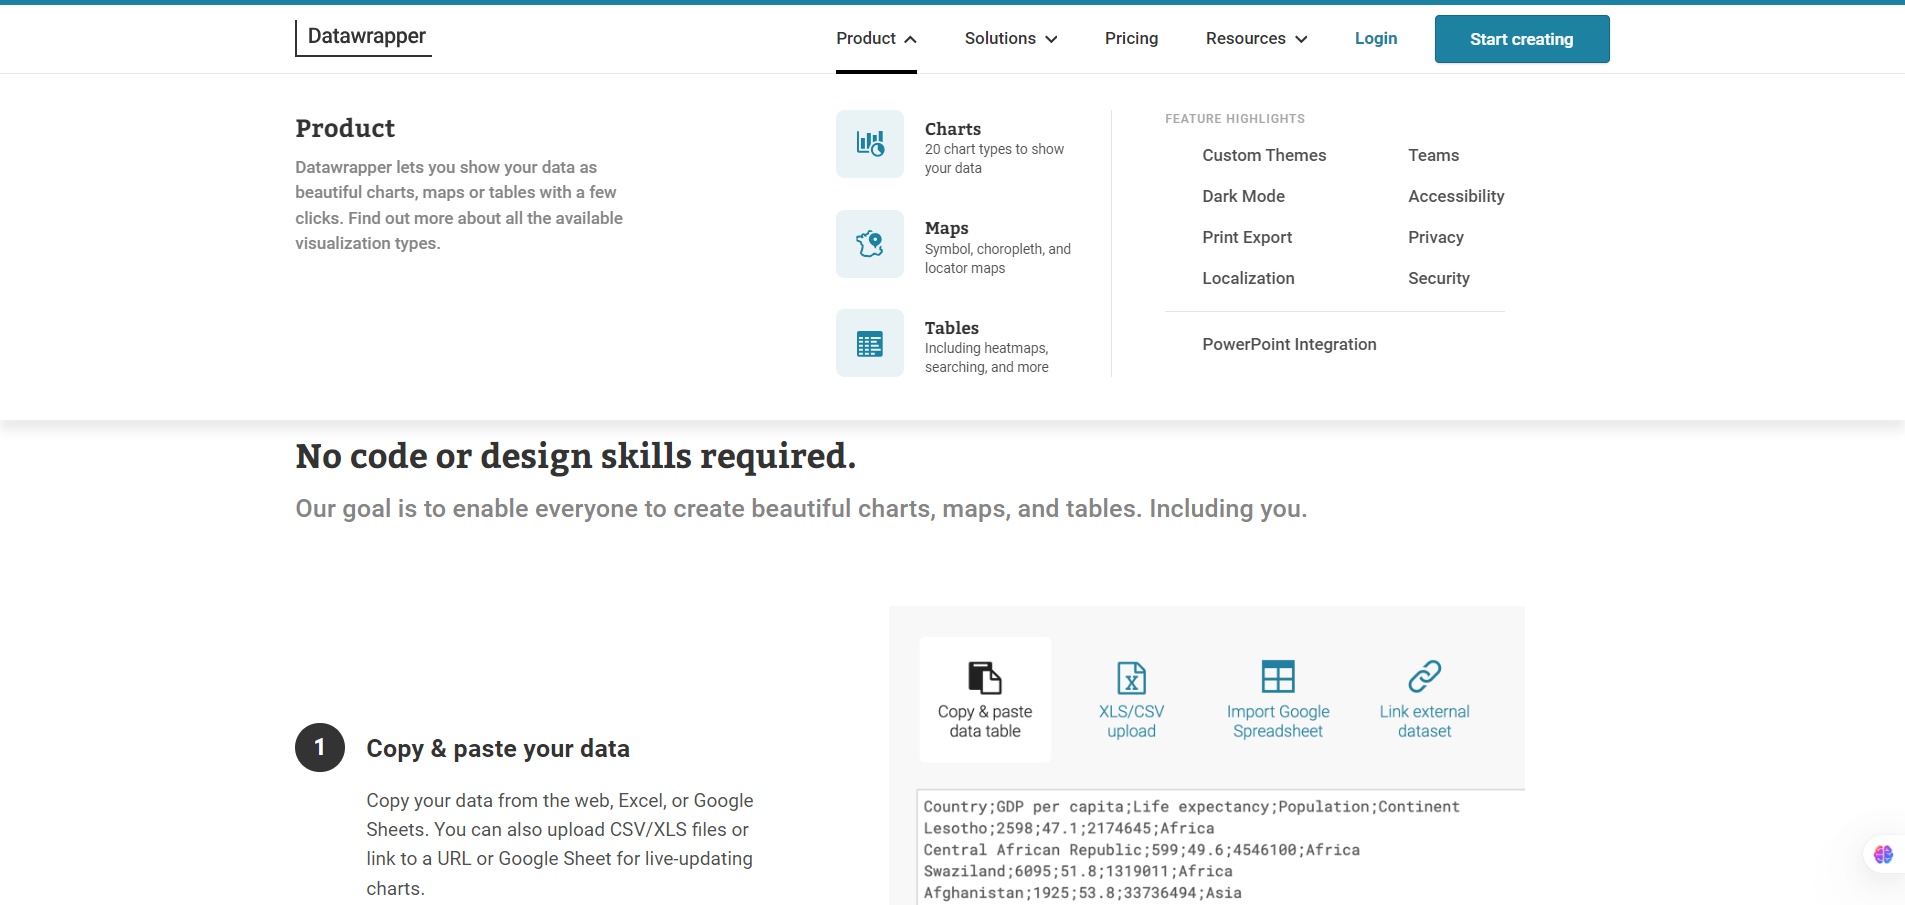
Datawrapper is a web-based visualization tool that allows you to upload or paste data and quickly build interactive charts, maps and tables—no coding required.
If you need to communicate data clearly—whether you’re a journalist, analyst, researcher or marketer—Datawrapper helps you produce visually appealing graphics that can be embedded in websites or used in reports. It speeds up the workflow of turning spreadsheets into publishable visuals. It also supports teams and branding control for organizations.
You upload (or link) data (CSV, Excel, Google Sheets), choose a visualization type (bar, line, scatter, maps etc.), customize styling, then publish or embed the result. The interface locks you into Datawrapper’s design-default style (which is good for readability) but full branding or white-labelling requires a paid plan. Also: bigger data analysis tasks or dashboard-level work (multiple charts in one layout) are outside its core scope.