


Power BI is one of the leading tools for business intelligence and data visualization. It enables users to create reports, dashboards, and visualizations that help businesses understand their data and make informed decisions. However, Power BI’s pricing, limitations, and the complexity of some of its features may not meet every user’s needs. Many free Power BI alternatives offer similar functionalities, giving businesses more flexibility and control over their data. This article explores the top 15 free Power BI alternatives that cater to different business needs, from real-time analytics to data visualization, dashboarding, and even machine learning capabilities. We’ll compare the features, pricing, pros, and cons of each alternative to help you choose the best fit for your data analytics needs.
Why Consider Power BI Alternatives?
Although Power BI is powerful, it may not be the best fit for every organization. Some common reasons to explore Power BI alternatives include:
- Cost: Power BI can become expensive, especially for small businesses and individuals, with limitations on its free plan and high costs for premium features.
- Ease of Use: While Power BI is rich in features, it can be difficult for beginners to navigate and use effectively.
- Customization: Some alternatives offer more customizable options and allow users to tailor reports and dashboards to their unique needs.
- Open Source: Many free alternatives, like Metabase and Superset, offer open-source solutions with greater control and flexibility over your data.
Let’s dive into the top 15 free alternatives to Power BI, exploring what each has to offer.
15 Best Free Power BI Alternatives
-
Metabase
-
Superset
-
Grafana
-
Redash
-
RAWGraphs
-
Helical Insight
-
KNIME Analytics Platform
-
Orange Data Mining
-
Chart.js
-
Sisense
-
DBeaver
-
Pentaho Community Edition
-
CBoard
-
Datawrapper
-
Notion Everything
Comparison Table of Power BI Alternatives
| Product | Best For | Price Range | Key Features |
|---|---|---|---|
| Metabase | Easy self-service BI & dashboards | Free (open source); paid cloud/enterprise | No-code querying, SQL editor, interactive dashboards |
| Superset | Enterprise-grade data exploration & dashboarding | Free (open source); paid managed hosting | SQL Lab, rich chart gallery, role-based access |
| Grafana | Real-time metrics & monitoring dashboards | Free (open source); paid cloud tiers | Time-series dashboards, alerting, many data-source plugins |
| Redash | Querying & visualizing many data sources via SQL | Free (open source); some hosted forks exist | Query editor, data-source connectors, lightweight dashboards |
| RAWGraphs | Quick advanced charts from CSV/Excel | Free (open source, web) | Paste/upload data → complex charts; export SVG/PNG |
| Helical Insight | Full BI suite with reports, dashboards & embedding | Free open-source core; paid enterprise | Self-service reporting, dashboards, AI/NLP analytics |
| KNIME | End-to-end data science, ETL & analytics | Free (open source desktop); paid server | Visual workflows, 300+ connectors, ML integrations |
| Orange | Visual data mining & ML for beginners and experts | Free (open source) | Drag-and-drop workflows, interactive data exploration |
| Chart.js | Developers adding charts into web apps | Free (open source JS library) | Canvas-based charts, plugins, responsive design |
| Sisense | Embedded & enterprise analytics | Paid only; custom/enterprise pricing; free trial | AI-powered analytics, embedding, modeling layer |
| DBeaver | Analysts who live in SQL & want quick charts | Free (open source Community); paid Pro | Database management, SQL editor, basic visualization |
| Pentaho CE | Open-source BI suite with ETL & reporting | Free (Community Edition) | Data integration (Kettle), reporting, dashboards |
| CBoard | Self-service open BI dashboard platform | Free (open source) | Drag-and-drop dashboards, multidimensional analysis |
| Datawrapper | Publishing charts & maps for media/journalism | Powerful free plan; paid for higher usage | Charts, maps, tables; embeddable & exportable |
| Notion Everything | Template-based Notion dashboards for non-coders | Many free templates; paid bundles from ~$49 | Pre-built Notion dashboards & systems (OS-style templates) |
Top 15 Free Power BI Alternatives Reviews
1. Metabase (Free & Open Source)
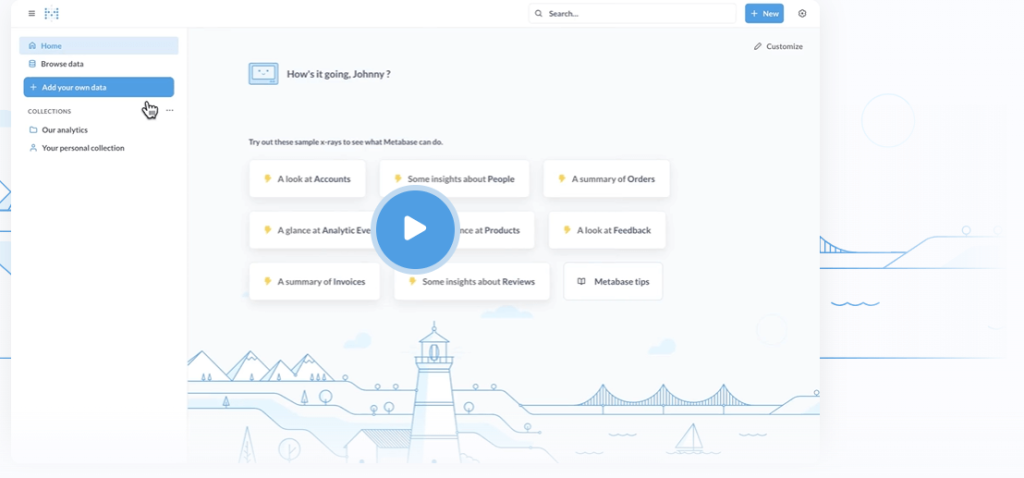 Best for: Easy-to-use analytics with SQL & NoSQL support Review: Metabase is an intuitive, open-source analytics platform ideal for teams looking to make data-driven decisions without needing advanced technical knowledge. It supports both SQL and NoSQL databases, enabling users to create interactive dashboards, visualizations, and reports. Its user-friendly interface allows non-technical users to ask questions and generate insights without writing complex queries. Features:
- SQL and NoSQL database support
- Simple, interactive dashboards
- Embedded analytics for external apps
- Automated email reports
Pros:
- Free and open-source
- Easy to set up and use
- Supports multiple data sources
Cons:
- Lacks advanced data manipulation features
- Limited in comparison to enterprise solutions like Tableau
Pricing:
- Free (Open Source), $85/month for the enterprise plan
2. Superset (by Apache) (Free & Open Source)
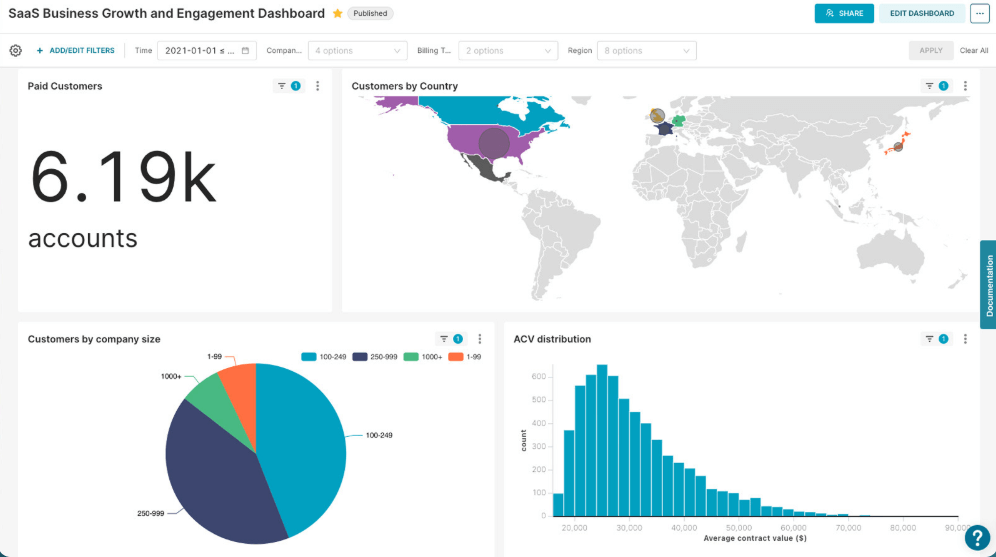 Best for: Enterprise-grade data exploration and dashboarding Review: Apache Superset is a powerful open-source business intelligence tool that allows users to explore and visualize data at scale. It is particularly useful for large enterprises and data-heavy applications. Superset provides advanced dashboarding, real-time analytics, and data exploration features, allowing users to dive deep into their data and create highly customized visualizations. Features:
- Advanced data exploration
- Real-time dashboards and analytics
- Integration with major databases
- SQL Lab for querying data
Pros:
- Completely open-source
- Scalable and customizable
- Works well with big data and cloud-based tools
Cons:
- Requires technical knowledge to set up
- Heavy on resources, not ideal for small teams
Pricing:
- Free (Open Source)
3. Grafana (Free & Open Source)
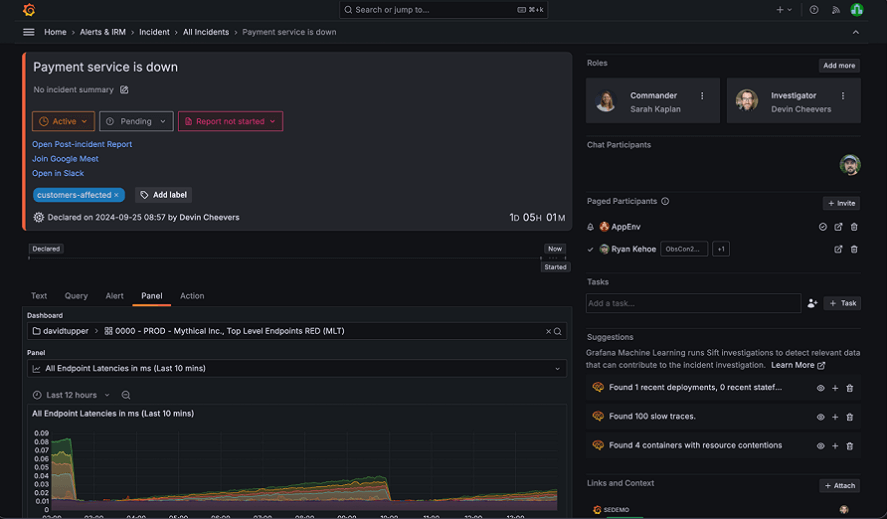
Best for: Real-time analytics and monitoring dashboards
Review: Grafana is a data visualization and monitoring platform widely used for real-time analytics. While it’s more focused on metrics monitoring for infrastructure and systems, Grafana also supports powerful visualizations of business data. It integrates seamlessly with various data sources such as Prometheus, InfluxDB, and more, making it ideal for users who need to monitor real-time performance and trends.
Features:
- Real-time dashboards for monitoring data
- Alerting for anomaly detection
- Wide range of data source integrations
- Support for custom plugins
Pros:
- Open-source and highly customizable
- Excellent for real-time data monitoring
- Scalable for large deployments
Cons:
- Not ideal for traditional business analytics
- Requires more technical setup compared to other BI tools
Pricing:
- Free (Open Source), $49/month for cloud plans
4. Redash (Free & Open Source)
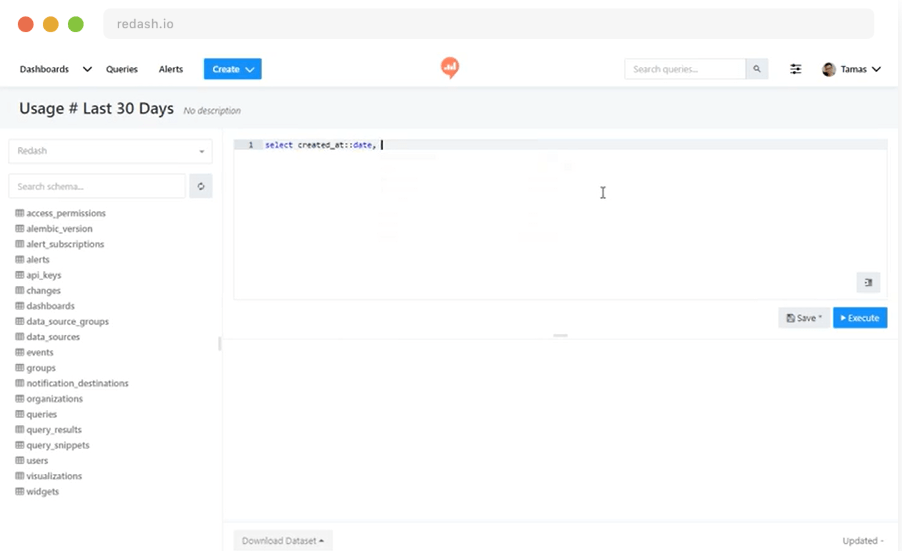
Best for: Querying and visualizing data from multiple sources
Review: Redash is designed for teams who need to query and visualize data from multiple data sources. It allows for the easy creation of dashboards with real-time data and supports SQL-based queries. Redash is perfect for teams that need a straightforward, lightweight BI tool for creating insights from data stored in databases or APIs.
Features:
- SQL editor for data querying
- Data source integrations (PostgreSQL, MySQL, MongoDB, etc.)
- Interactive dashboards and visualizations
- Collaborative features for sharing reports
Pros:
- Free and open-source
- Supports a wide range of data sources
- Simple setup and ease of use
Cons:
- Lacks advanced machine learning features
- User interface can be basic for some users
Pricing:
- Free (Open Source), $49/month for cloud plans
5. RAWGraphs (Free & Open Source)
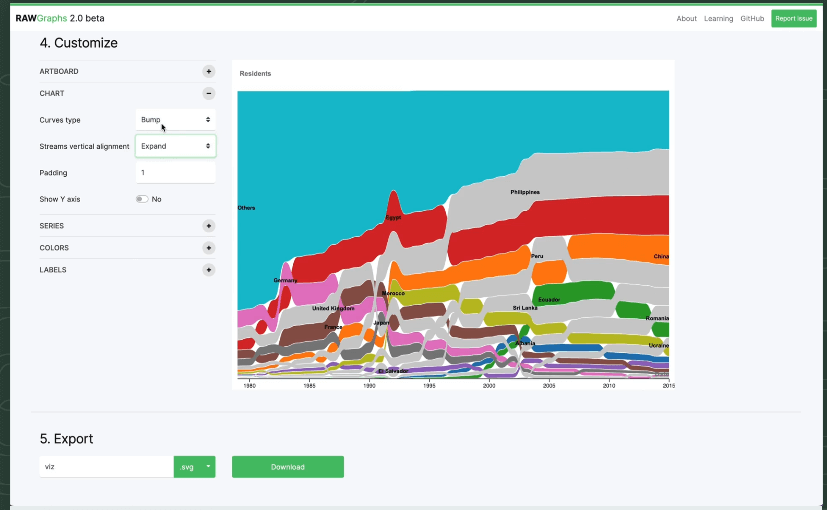
Best for: Creating advanced charts from Excel/CSV files
Review: RAWGraphs is an open-source tool specifically designed to create advanced data visualizations from CSV or Excel files. It’s great for creating charts such as heatmaps, scatter plots, and tree maps. While it’s not a full BI tool like Power BI, RAWGraphs excels at transforming raw data into insightful and interactive visualizations.
Features:
- Wide range of chart types (heatmaps, dendrograms, etc.)
- CSV/Excel file support
- Customization options for charts
- Web-based tool, no installation required
Pros:
- Free and open-source
- Very easy to use for basic visualizations
- Perfect for data journalism and reports
Cons:
- Not as feature-rich for enterprise-level BI
- Lacks data exploration features
Pricing:
- Free (Open Source)
6. Helical Insight

Best For: Open-source BI suite with reports, dashboards & AI analytics
Review:
Helical Insight is an open-source BI framework positioned directly as an alternative to tools like Power BI and Tableau. It includes reporting, dashboards, scheduling, and embedding, and recent versions even add AI/LLM-powered analytics.
Features:
-
Drag-and-drop charts and dashboards
-
Pixel-perfect “canned” reporting
-
AI/NLP-driven analytics and chat-style querying
-
Email scheduling, alerts, and mobile-friendly outputs
Pros:
-
Full-stack BI (reports, dashboards, embedding)
-
Open source with strong extensibility
-
Flexible deployment (on-premise or cloud)
Cons:
-
Setup and customization can require Java expertise
-
Smaller community than Superset or Metabase
Pricing:
Open-source core is free. Enterprise editions and support are paid (custom pricing).
7. KNIME Analytics Platform (Free & Open Source)
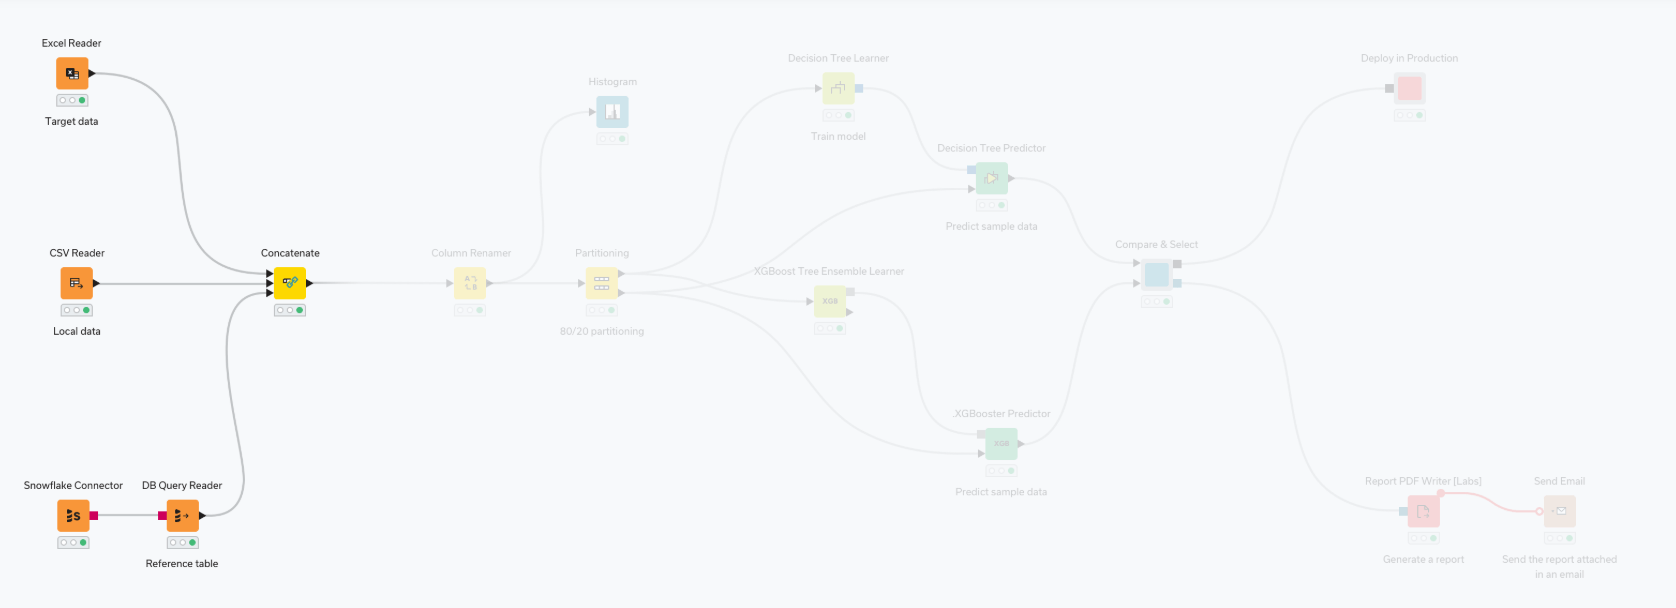 Best for: Visual data analytics and ETL workflows Review: KNIME is a powerful open-source platform designed for data analytics, ETL workflows, and machine learning. It’s a great choice for teams looking for an advanced analytics platform with visual programming capabilities. KNIME supports numerous data processing tasks, such as data mining, modeling, and data visualization. Features:
- Visual programming interface
- ETL workflows and data integration
- Integration with machine learning tools
- Data visualization capabilities
Pros:
- Free and open-source
- Excellent for advanced data analysis
- Customizable with nodes and extensions
Cons:
- Steeper learning curve
- May be overkill for simple use cases
Pricing:
- Free (Open Source), $1,250/year for commercial use
8. Orange (Free & Open Source)
 Best for: Visual programming for data analysis and machine learning Review: Orange is a visual programming tool for data analysis and machine learning. It allows users to perform data visualization, classification, and regression without writing code. With its intuitive, drag-and-drop interface, Orange is perfect for users who want to explore and analyze data using machine learning techniques. Features:
- Drag-and-drop interface for easy analysis
- Supports data visualization, classification, and regression
- Machine learning features with plugins
Pros:
- Free and open-source
- User-friendly for beginners in machine learning
- Extensive library of algorithms and visualizations
Cons:
- Not as powerful for big data processing
- Basic UI compared to commercial tools
Pricing:
- Free (Open Source)
9. Chart.js
Best For: Developers building custom dashboards inside web apps
Review:
Chart.js is a hugely popular open-source JavaScript charting library for canvas-based charts. It’s perfect when you want to embed analytics directly into your own product or internal tools, instead of sending users to a separate BI portal.
Features:
-
Line, bar, pie, radar, bubble, mixed charts and more
-
Responsive and mobile-friendly
-
Plugin system (zoom, annotations, data labels, etc.)
-
Works with any frontend framework (React, Vue, etc.)
Pros:
-
Very flexible for developers
-
Lightweight compared to full BI tools
-
Massive ecosystem and long-term community support
Cons:
-
No data modeling, scheduling, or dashboards out of the box
-
Requires coding skills and your own backend/hosting
Pricing:
Free & open source (MIT license).
10. Sisense (Paid with Free Trial)
Best For: Business intelligence and data analytics for enterprises
Review:
Sisense is a powerful business intelligence (BI) platform that enables businesses to analyze and visualize their data with ease. It provides robust analytics, integrations, and customizability for large-scale data environments. While Sisense is a paid service, it offers a free trial that can be helpful for organizations to test its capabilities. Sisense is especially suited for organizations needing advanced data preparation, AI-powered insights, and integration with multiple data sources.
Features:
-
Advanced data analytics and visualization
-
AI-driven insights and predictions
-
Integration with various data sources (cloud and on-premises)
-
Customizable dashboards and reports
Pros:
-
Powerful analytics and visualization tools
-
AI-powered analytics for deeper insights
-
Great for enterprises with complex data needs
-
Customizable reporting and dashboards
Cons:
-
Expensive for small businesses
-
Requires technical setup and expertise for full utilization
Pricing:
Free trial available, paid plans starting at $83/month
11. DBeaver + Charts
Best for: Lightweight database tool with charting capabilities
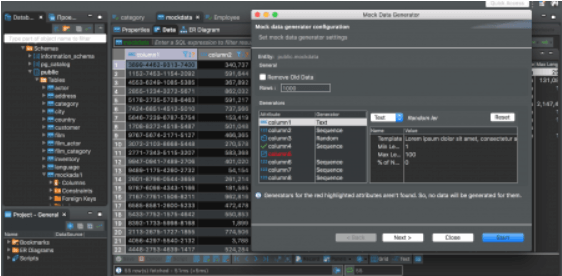
Review: DBeaver is a lightweight database tool that allows for easy data visualization with the help of the Charts plugin. It’s ideal for users who need a tool to connect to databases like MySQL, PostgreSQL, and SQLite, while also being able to create basic charts and visualizations.
Features:
- Database management and visualization
- Charting capabilities for SQL data
- Lightweight and fast
Pros:
- Free and open-source
- Excellent for database management and querying
- Great for users needing basic charts
Cons:
- Limited data visualization compared to Power BI
- Basic UI
Pricing:
- Free (Open Source)
12. Pentaho Community Edition
 Best for: Business analytics and data integration
Review: Pentaho is a comprehensive business analytics platform that includes data integration, reporting, and data mining capabilities. The Community Edition offers open-source access to ETL (Extract, Transform, Load) tools, which makes it a great choice for teams needing data integration along with business intelligence features.
Features:
- ETL tools for data integration
- Business analytics and reporting
- Supports big data processing
Pros:
- Free and open-source
- Powerful for data integration and analytics
- Suitable for big data environments
Cons:
-
- Complex setup and learning curve
- Requires more technical knowledge
Pricing:
-
- Free (Open Source), $1,000+/year for commercial versions
13. CBoard (Free & Open Source)
 Best for: Self-hosted dashboard builder for multiple data sources Review: CBoard is an open-source dashboard builder that allows you to create real-time dashboards by connecting to various data sources. Ideal for self-hosting, CBoard offers flexibility for teams looking to manage and display data from multiple systems while ensuring data security through self-hosting. Features:
- Real-time dashboards
- Integration with multiple data sources
- Self-hosting options for data security
Pros:
- Free and open-source
- Great for real-time data visualization
- Suitable for self-hosting for enhanced security
Cons:
- Requires technical setup
- Lacks some advanced features compared to commercial options
Pricing:
- Free (Open Source)
14. Datawrapper
 Best for: Publishing charts and maps for media and journalism Review: Datawrapper is a free tool designed for journalists and teams needing to **visualize and publish data**. It’s ideal for creating charts, maps, and simple visualizations that can be embedded into websites or shared on social media. Features:
- Chart creation and map publishing
- Simple data visualization interface
- Exportable charts for websites or articles
Pros:
- Free and easy to use
- Great for journalism and media outlets
- Clean design and professional visuals
Cons:
- Limited advanced features
- Not designed for complex data analysis
Pricing:
- Free (with limitations), $400/year for premium features
15. Notion Everything
Best For: No-code dashboards built on Notion templates
Review:
Notion Everything is a boutique marketplace for high-quality Notion templates, including dashboard systems for tasks, finances, content planning, and more.
Instead of being a standalone BI engine, it helps you turn Notion into a lightweight analytics and operations hub using pre-built databases, formulas, and views.
Features:
-
Pre-built Notion dashboards for tasks, finances, CRM, creators, etc.
-
Combines tables, filters, relations, rollups, and charts inside Notion
-
Many templates include reporting pages and analytics summaries
-
Works on top of Notion’s free or paid plans
Pros:
-
Perfect for solo founders, creators, and small teams already in Notion
-
No coding required; you just duplicate and adapt a template
-
Many high-quality templates (some free) built by Notion specialists
Cons:
-
Not a classic BI engine; limited to Notion’s data capabilities
-
Complex analytics or big datasets are better handled elsewhere
Pricing:
-
Notion: free plan for personal use; paid tiers for teams (from Notion).
-
Notion Everything: mix of free templates and paid bundles (often around one-time purchases like $30–$100+, depending on the system).
How to Choose the Best Power BI Alternative
When choosing the best free Power BI alternative, consider the following factors:
- Features Needed: If you need advanced analytics or machine learning capabilities, look for tools like KNIME or Orange. For simple data visualization, tools like Metabase or Google Data Studio will suffice.
- Ease of Use: For beginners or small teams, platforms like Datawrapper, Vizydrop, or Unleash Chat offer easy-to-use interfaces.
- Self-hosting: If you need full control over your data, consider Mattermost, Rocket.Chat, or CBoard, all of which offer self-hosting options.
- Integrations: Check if the tool integrates well with your existing software stack, whether it’s Google Analytics, SQL databases, or other third-party tools.
- Community Support: Open-source tools like Superset and Metabase offer strong community support, which is crucial if you need assistance or troubleshooting.
Conclusion
There are numerous free alternatives to Power BI that offer robust data visualization, analytics, and dashboarding capabilities. Whether you’re looking for an easy-to-use tool like Metabase, a secure self-hosted solution like Mattermost, or a powerful real-time dashboarding platform like Grafana, these alternatives provide a wide range of options for businesses of all sizes.
What is the best free Power BI alternative?
Metabase is a great free alternative, providing powerful analytics and SQL support.
Can I use Google Data Studio as a Power BI alternative?
Yes, Google Data Studio is a free and excellent option for creating interactive dashboards and reports.
Is Grafana a good alternative to Power BI?
Yes, Grafana excels at real-time data visualization and is perfect for monitoring metrics and performance.
Can I use Tableau Public as a free Power BI alternative?
Yes, Tableau Public is free but with limitations, and it’s ideal for cloud-based visualization and public sharing.
Is Metabase easy to use for non-technical teams?
Yes, Metabase is designed to be user-friendly for both technical and non-technical users, making it a great choice for data-driven teams.

